Press
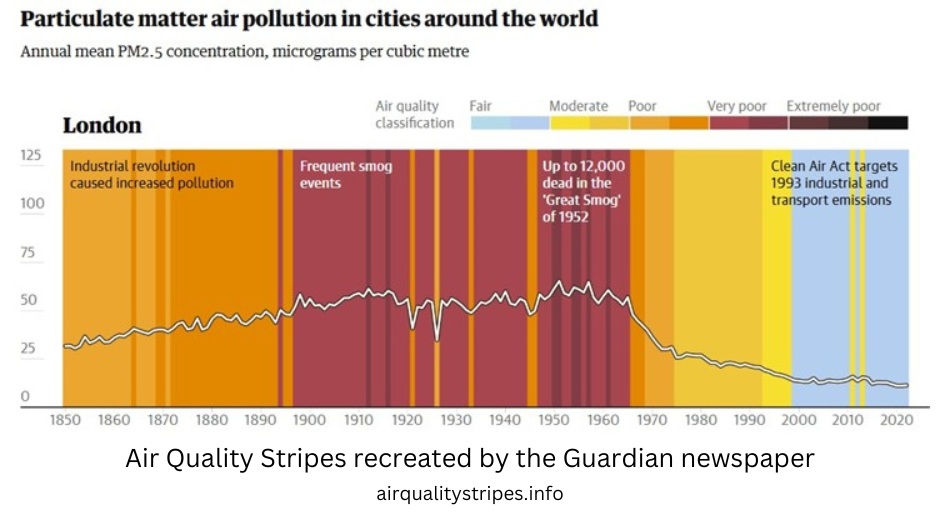
The Air Quality Stripes has been featured in newspapers around the world, helping to provide background to the images and highlight the global scale of the problem. We share some selected press coverage below.
The Guardian: Can climate stripes change the way we think about air pollution?
"A team of scientists have created a new way to visualise the contrasts in air pollution breathed around the globe. The results show huge inequalities in the quality of air, with the situation worsening in many countries.
But the new project also tells a positive story: that focused action by governments can lead to cleaner air." – Gary Fuller

The Conversation: These colourful diagrams show how air quality has changed in over 100 countries around the world since 1850
"Air pollution is an unseen menace that poses a major threat to human health and the climate. We have created the air quality stripes, a visual tool that captures global air pollution trends, to bring this hidden threat into sharp focus.
Inspired by professor of climate science Ed Hawkins' climate warming stripes, the air quality stripes depict particulate matter (PM) concentrations in 176 cities worldwide since 1850. These tiny particles, often smaller than one-30th of the width of a human hair, can penetrate deep into the lungs, posing serious health risks.
By making air pollution more visible, the stripes provide a clear way to understand how air quality has evolved over time across different regions." – Sam Illingworth, Jim McQuaid, Kirsty Pringle
The Conversation: The new climate stripes? How creativity can inspire environmental action
"Without context, vast numbers are meaningless. Data can be incredibly dry, abstract and difficult to visualise. But sometimes scientists find clever ways of presenting complex information in creative, eye-catching and more tangible forms." – Anna Turns
BBC World: A famous climate graphic is running out of red
"The climate stripes are also being reimagined to help illustrate other crises facing the planet. Not all have a negative story to tell either.
The "air quality stripes" for major cities around the world, show outdoor concentrations of particulate matter (PM2.5) air pollution from 1850 to 2021 based on satellite data and climate models. In some major cities the stripes show how air quality has actually improved as measures to tackle air pollution have taken effect. But there are still many where the air has worsened.” - Carla Rosch


